
 Huisly
€900 /mo
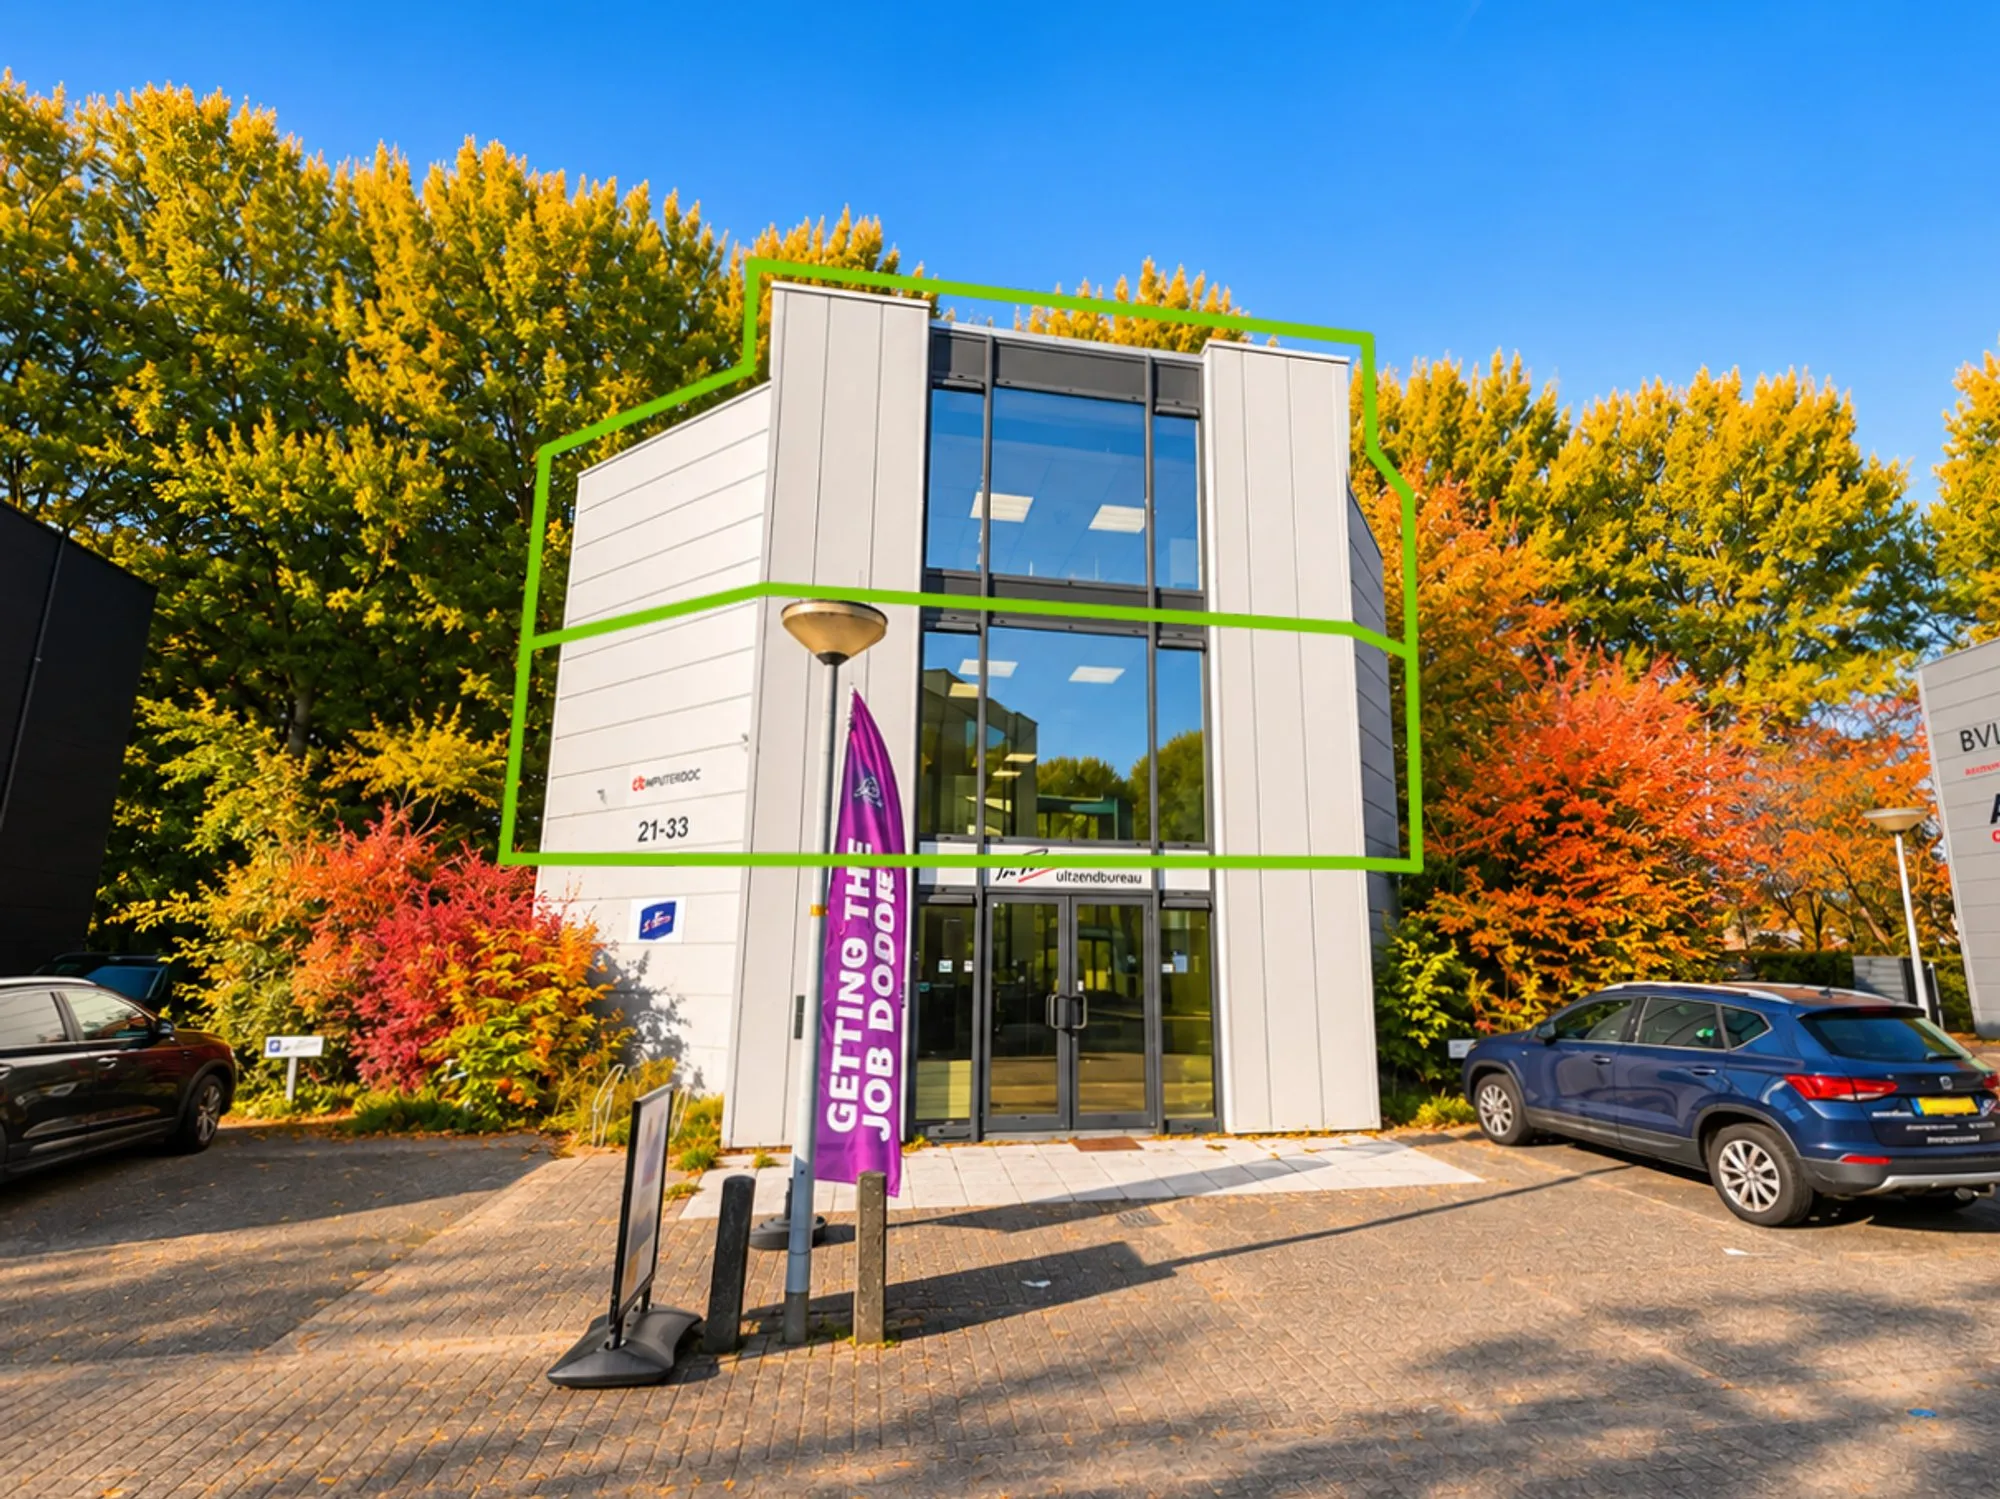
Randstad 21 33
Almere
140 m²A+
Neighbourhood
Facts and figures about the Randstad West neighbourhood in Randstad, Almere from Statistics Netherlands (CBS). Each figure shows the date or year it describes and, where available, the same figure for Randstad, Almere and the Netherlands over that period.
Residents
5
Households
5
Homes
2
The homes most recently listed in the Randstad West neighbourhood in Randstad, Almere, newest first.
The Leefbaarometer is a model-based estimate of liveability by the Dutch Ministry of the Interior and Kingdom Relations, updated every two years.
Leefbaarometer score in 2024
4.03
From 2022 to 2024: 0.07 lower, from 4.10 to 4.03.
The publisher converted the scores for 2002, 2008, 2012 and 2016 from an earlier version of its model to fit the current one.
Source: Leefbaarometer, Ministerie van Binnenlandse Zaken en Koninkrijksrelaties, CC0 1.0. leefbaarometer.nl · Leefbaarometer license
Crimes the police registered in Randstad West, by year from 2012 to 2025.
Registered crimes in 2025
17
From 2024 to 2025: 9 more, from 8 to 17.
Home burglary or theft
0
Garage, shed or storage burglary or theft
0
Theft of bicycles and mopeds
0
Theft from motor vehicles
9
Theft of motor vehicles
0
Vandalism and property damage
1
Assault
0
Threats
0
| Kind of crime | 2012 to 2025 | 2025 | 2024 | 2023 | 2022 | 2021 | 2020 | 2019 | 2018 | 2017 | 2016 | 2015 | 2014 | 2013 | 2012 |
|---|---|---|---|---|---|---|---|---|---|---|---|---|---|---|---|
| Total crimes | 17 | 8 | 10 | 7 | 0 | 5 | 3 | 4 | 5 | 5 | 10 | 9 | 9 | 11 | |
| Home burglary or theft | 0 | 0 | 0 | 0 | 0 | 0 | 0 | 0 | 0 | 0 | 0 | 0 | 0 | 0 | |
| Garage, shed or storage burglary or theft | 0 | 0 | 0 | 0 | 0 | 0 | 0 | 0 | 0 | 0 | 0 | 0 | 0 | 0 | |
| Theft from motor vehicles | 9 | 0 | 1 | 0 | 0 | 4 | 0 | 0 | 0 | 0 | 0 | 2 | 1 | 0 | |
| Theft of motor vehicles | 0 | 0 | 0 | 0 | 0 | 0 | 0 | 0 | 0 | 0 | 0 | 0 | 0 | 0 | |
| Theft of bicycles and mopeds | 0 | 1 | 1 | 0 | 0 | 0 | 0 | 0 | 0 | 0 | 1 | 0 | 0 | 0 | |
| Pickpocketing | 0 | 0 | 0 | 0 | 0 | 0 | 0 | 0 | 0 | 0 | 0 | 0 | 0 | 0 | |
| Theft of or from other vehicles | 3 | 0 | 0 | 0 | 0 | 0 | 0 | 0 | 0 | 0 | 0 | 0 | 0 | 0 | |
| Road accidents | 0 | 1 | 0 | 1 | 0 | 0 | 0 | 0 | 1 | 0 | 1 | 0 | 2 | 1 | |
| Murder and manslaughter | 0 | 0 | 0 | 0 | 0 | 0 | 0 | 0 | 0 | 0 | 0 | 0 | 0 | 0 | |
| Public violence against people | 0 | 0 | 0 | 0 | 0 | 0 | 0 | 0 | 0 | 0 | 0 | 0 | 0 | 0 | |
| Threats | 0 | 1 | 2 | 3 | 0 | 0 | 0 | 0 | 0 | 0 | 0 | 1 | 0 | 0 | |
| Assault | 0 | 1 | 0 | 2 | 0 | 0 | 0 | 0 | 0 | 0 | 0 | 1 | 0 | 0 | |
| Street robbery | 0 | 0 | 0 | 0 | 0 | 0 | 0 | 0 | 0 | 0 | 0 | 0 | 0 | 0 | |
| Hold-ups | 0 | 0 | 0 | 0 | 0 | 0 | 0 | 0 | 0 | 0 | 0 | 0 | 0 | 0 | |
| Thefts (on water) | 0 | 0 | 0 | 0 | 0 | 0 | 0 | 0 | 0 | 0 | 0 | 0 | 0 | 0 | |
| Arson and explosions | 0 | 0 | 0 | 0 | 0 | 0 | 0 | 0 | 0 | 0 | 0 | 0 | 0 | 0 | |
| Other property crimes | 1 | 1 | 1 | 0 | 0 | 0 | 1 | 0 | 2 | 2 | 3 | 0 | 2 | 0 | |
| Human trafficking | 0 | 0 | 0 | 0 | 0 | 0 | 0 | 0 | 0 | 0 | 0 | 0 | 0 | 0 | |
| Drugs and drink nuisance | 0 | 0 | 0 | 0 | 0 | 0 | 0 | 0 | 0 | 0 | 0 | 0 | 0 | 0 | |
| Vandalism and property damage | 1 | 0 | 1 | 0 | 0 | 0 | 2 | 2 | 1 | 0 | 1 | 0 | 0 | 1 | |
| Domestic disturbance (relationship problems) | 0 | 0 | 0 | 0 | 0 | 0 | 0 | 0 | 0 | 0 | 0 | 0 | 0 | 0 | |
| Trespass | 0 | 0 | 0 | 0 | 0 | 0 | 0 | 0 | 0 | 0 | 0 | 0 | 0 | 0 | |
| Burglary or theft at businesses and other premises | 1 | 2 | 2 | 0 | 0 | 0 | 0 | 0 | 0 | 0 | 3 | 1 | 2 | 7 | |
| Shoplifting | 0 | 0 | 0 | 0 | 0 | 0 | 0 | 0 | 0 | 0 | 0 | 0 | 0 | 0 | |
| Environmental Management Act facilities | 0 | 0 | 0 | 0 | 0 | 0 | 0 | 0 | 0 | 0 | 0 | 0 | 0 | 0 | |
| Soil | 0 | 0 | 0 | 0 | 0 | 0 | 0 | 0 | 0 | 0 | 0 | 0 | 0 | 0 | |
| Water | 0 | 0 | 0 | 0 | 0 | 0 | 0 | 0 | 0 | 0 | 0 | 0 | 0 | 0 | |
| Waste | 0 | 0 | 0 | 0 | 0 | 0 | 0 | 0 | 0 | 0 | 0 | 0 | 0 | 0 | |
| Building materials | 0 | 0 | 0 | 0 | 0 | 0 | 0 | 0 | 0 | 0 | 0 | 0 | 0 | 0 | |
| Manure | 0 | 0 | 0 | 0 | 0 | 0 | 0 | 0 | 0 | 0 | 0 | 0 | 0 | 0 | |
| Transport of dangerous substances | 0 | 0 | 0 | 0 | 0 | 0 | 0 | 0 | 0 | 0 | 0 | 0 | 0 | 0 | |
| Fireworks | 0 | 0 | 0 | 0 | 0 | 0 | 0 | 0 | 0 | 0 | 0 | 0 | 0 | 0 | |
| Pesticides | 0 | 0 | 0 | 0 | 0 | 0 | 0 | 0 | 0 | 0 | 0 | 0 | 0 | 0 | |
| Nature and landscape | 0 | 0 | 0 | 0 | 0 | 0 | 0 | 0 | 0 | 0 | 0 | 0 | 0 | 0 | |
| Spatial planning | 0 | 0 | 0 | 0 | 0 | 0 | 0 | 0 | 0 | 0 | 0 | 0 | 0 | 0 | |
| Animals | 0 | 0 | 0 | 0 | 0 | 0 | 0 | 0 | 0 | 0 | 0 | 0 | 0 | 0 | |
| Food safety | 0 | 0 | 0 | 0 | 0 | 0 | 0 | 0 | 0 | 0 | 0 | 0 | 0 | 0 | |
| Special laws | 0 | 0 | 0 | 0 | 0 | 0 | 0 | 0 | 0 | 0 | 0 | 0 | 0 | 0 | |
| Liveability (other) | 0 | 0 | 0 | 0 | 0 | 0 | 0 | 0 | 0 | 0 | 0 | 0 | 0 | 0 | |
| Drug trade | 1 | 0 | 0 | 0 | 0 | 0 | 0 | 0 | 0 | 0 | 0 | 0 | 0 | 0 | |
| People smuggling | 0 | 0 | 0 | 0 | 0 | 0 | 0 | 0 | 0 | 0 | 0 | 0 | 0 | 0 | |
| Weapons trade | 0 | 0 | 0 | 0 | 0 | 0 | 0 | 0 | 0 | 0 | 0 | 0 | 0 | 0 | |
| Under the influence (air) | 0 | 0 | 0 | 0 | 0 | 0 | 0 | 0 | 0 | 0 | 0 | 0 | 0 | 0 | |
| Air (other) | 0 | 0 | 0 | 0 | 0 | 0 | 0 | 0 | 0 | 0 | 0 | 0 | 0 | 0 | |
| Under the influence (water) | 0 | 0 | 0 | 0 | 0 | 0 | 0 | 0 | 0 | 0 | 0 | 0 | 0 | 0 | |
| Under the influence (road) | 1 | 1 | 0 | 0 | 0 | 0 | 0 | 1 | 0 | 0 | 0 | 0 | 1 | 0 | |
| Road (other) | 0 | 0 | 1 | 0 | 0 | 0 | 0 | 0 | 0 | 0 | 0 | 0 | 0 | 0 | |
| Public order offences | 0 | 0 | 1 | 0 | 0 | 0 | 0 | 0 | 0 | 0 | 0 | 0 | 0 | 0 | |
| Discrimination | 0 | 0 | 0 | 0 | 0 | 0 | 0 | 0 | 0 | 0 | 0 | 0 | 0 | 0 | |
| Immigration control | 0 | 0 | 0 | 0 | 0 | 0 | 0 | 0 | 0 | 0 | 0 | 0 | 0 | 0 | |
| Cybercrime | 0 | 0 | 0 | 0 | 0 | 0 | 0 | 0 | 0 | 0 | 0 | 1 | 0 | 0 | |
| Fraud against people and businesses | 0 | 0 | 0 | 0 | 0 | 1 | 0 | 0 | 1 | 2 | 0 | 0 | 0 | 0 | |
| Fraud against the government | 0 | 0 | 0 | 0 | 0 | 0 | 0 | 0 | 0 | 0 | 0 | 0 | 0 | 0 | |
| Fraud (other) | 0 | 0 | 0 | 0 | 0 | 0 | 0 | 0 | 0 | 0 | 0 | 3 | 1 | 0 |
A dot (.) means the publisher published no figure for that year. It is not a zero.
Politie (published by Statistics Netherlands, CBS), table 47018NED, version of 16 November 2026, licensed under CC BY 4.0. Huisly translated the names of the kinds of crime, arranged the figures and drew the charts. The counts are as published. The table at data.politie.nl
Source: Politie (published by Statistics Netherlands, CBS), CC BY 4.0. Names translated and figures charted by Huisly.
Homes and their value, who owns them and what types of homes there are.
Newly built homes
0
| Figure | Randstad West | Randstad | Almere | Netherlands | Period |
|---|---|---|---|---|---|
| Homes | 2 | 62 | 94,045 | 8,274,478 | 1 Jan 2025 |
| Newly built homes | 0 | 0 | 1,199 | 69,189 | 2025 |
Residents by age, sex, marital status and origin.
Births per 1,000 residents
0
Deaths per 1,000 residents
0
| Randstad West | Randstad | Almere | Netherlands | |
|---|---|---|---|---|
| Men | 100%5 | 78.6%55 | 49.5%115,214 | 49.8%9,025,827 |
| Women | 0%0 | 21.4%15 | 50.5%117,405 | 50.2%9,104,381 |
| Randstad West | Randstad | Almere | Netherlands | |
|---|---|---|---|---|
| Never married | 0%0 | 78.6%55 | 53.1%123,585 | 50.2%9,101,569 |
| Married | 100%5 | 21.4%15 | 35.8%83,321 | 37.3%6,758,191 |
| Divorced | 0%0 | 0%0 | 8.3%19,237 | 7.7%1,404,105 |
| Widowed | 0%0 | 0%0 | 2.8%6,476 | 4.8%866,343 |
| Randstad West | Randstad | Almere | Netherlands | |
|---|---|---|---|---|
| Dutch origin | 100%5 | 13.3%10 | 48.4%112,502 | 70.9%12,859,141 |
| European origin (outside the Netherlands) | 0%0 | 0%0 | 9.2%21,310 | 9.6%1,739,260 |
| Origin outside Europe | 0%0 | 86.7%65 | 42.5%98,807 | 19.5%3,531,807 |
| Randstad West | Randstad | Almere | Netherlands | |
|---|---|---|---|---|
| Born in the Netherlands, Dutch origin | 100%5 | 13.3%10 | 48.4%112,502 | 70.9%12,859,141 |
| Born in the Netherlands, European origin | 0%0 | 0%0 | 3.3%7,578 | 3.4%614,116 |
| Born in the Netherlands, origin outside Europe | 0%0 | 6.7%5 | 19.3%45,007 | 8.5%1,532,223 |
| Born elsewhere in Europe | 0%0 | 0%0 | 5.9%13,732 | 6.2%1,125,144 |
| Born outside Europe | 0%0 | 80%60 | 23.1%53,800 | 11%1,999,584 |
| Figure | Randstad West | Randstad | Almere | Netherlands | Period |
|---|---|---|---|---|---|
| Residents | 5 | 75 | 232,619 | 18,130,208 | 1 Jan 2026 |
| Men | 5 | 55 | 115,214 | 9,025,827 | 1 Jan 2026 |
| Women | 0 | 15 | 117,405 | 9,104,381 | 1 Jan 2026 |
| 0–14 years | 0 | 5 | 41,508 | 2,683,698 | 1 Jan 2026 |
| 15–24 years | 0 | 0 | 28,367 | 2,203,633 | 1 Jan 2026 |
| 25–44 years | 0 | 60 | 68,663 | 4,699,676 | 1 Jan 2026 |
| 45–64 years | 0 | 5 | 60,122 | 4,709,693 | 1 Jan 2026 |
| 65–79 years | 0 | 5 | 28,560 | 2,876,999 | 1 Jan 2026 |
| 80 years and over | 0 | 0 | 5,399 | 956,509 | 1 Jan 2026 |
| Never married | 0 | 55 | 123,585 | 9,101,569 | 1 Jan 2026 |
| Married | 5 | 15 | 83,321 | 6,758,191 | 1 Jan 2026 |
| Divorced | 0 | 0 | 19,237 | 1,404,105 | 1 Jan 2026 |
| Widowed | 0 | 0 | 6,476 | 866,343 | 1 Jan 2026 |
| Dutch origin | 5 | 10 | 112,502 | 12,859,141 | 1 Jan 2026 |
| European origin (outside the Netherlands) | 0 | 0 | 21,310 | 1,739,260 | 1 Jan 2026 |
| Origin outside Europe | 0 | 65 | 98,807 | 3,531,807 | 1 Jan 2026 |
| Born in the Netherlands, Dutch origin | 5 | 10 | 112,502 | 12,859,141 | 1 Jan 2026 |
| Born in the Netherlands, European origin | 0 | 0 | 7,578 | 614,116 | 1 Jan 2026 |
| Born in the Netherlands, origin outside Europe | 0 | 5 | 45,007 | 1,532,223 | 1 Jan 2026 |
| Born elsewhere in Europe | 0 | 0 | 13,732 | 1,125,144 | 1 Jan 2026 |
| Born outside Europe | 0 | 60 | 53,800 | 1,999,584 | 1 Jan 2026 |
| Births | 0 | 5 | 2,518 | 166,588 | 2025 |
| Births per 1,000 residents | 0 | 25 | 11 | 9 | 2025 |
| Deaths | 0 | 0 | 1,377 | 173,494 | 2025 |
| Deaths per 1,000 residents | 0 | 0 | 6 | 10 | 2025 |
| 65 years and over | 0 | 0 | 32,510 | 3,755,679 | 1 Jan 2025 |
| Residents aged 15 and over | 10 | 70 | 191,160 | 15,450,520 | 31 Dec 2025 |
| Residents aged 15 up to state pension age | 10 | 70 | 162,630 | 12,071,600 | 31 Dec 2025 |
| Residents of state pension age | 0 | 0 | 28,530 | 3,378,920 | 31 Dec 2025 |
| Figure | 1 Jan 2024 | 1 Jan 2025 | 1 Jan 2026 |
|---|---|---|---|
| Residents | 5 | 5 | 5 |
| Men | 5 | 5 | 5 |
| Women | 5 | 5 | 0 |
| 0–14 years | 0 | 0 | 0 |
| 15–24 years | 5 | 0 | 0 |
| 25–44 years | 5 | 5 | 0 |
| 45–64 years | 0 | 0 | 0 |
| Never married | 5 | 5 | 0 |
| Married | 5 | 5 | 5 |
| Divorced | 0 | 0 | 0 |
| Widowed | 0 | 0 | 0 |
| Dutch origin | 5 | 5 | 5 |
| European origin (outside the Netherlands) | 0 | 0 | 0 |
| Origin outside Europe | 5 | 5 | 0 |
| Born in the Netherlands, Dutch origin | 5 | 5 | 5 |
| Born in the Netherlands, European origin | 0 | 0 | 0 |
| Born in the Netherlands, origin outside Europe | 5 | 0 | 0 |
| Born elsewhere in Europe | 0 | 5 | 0 |
| Born outside Europe | 5 | 0 | 0 |
| Figure | 31 Mar 2025 | 30 Jun 2025 | 30 Sept 2025 | 31 Dec 2025 |
|---|---|---|---|---|
| Residents aged 15 and over | 10 | 10 | 10 | 10 |
| Residents aged 15 up to state pension age | 10 | 10 | 10 | 10 |
| Residents of state pension age | 0 | 0 | 0 | 0 |
How many households there are and how they are made up.
Average household size
1.3
| Randstad West | Randstad | Almere | Netherlands | |
|---|---|---|---|---|
| Single-person households | 100%5 | 91.7%55 | 33.8%33,602 | 40.3%3,412,202 |
| Households without children | 0%0 | 8.3%5 | 24.4%24,222 | 28.3%2,398,121 |
| Households with children | 0%0 | 0%0 | 41.8%41,523 | 31.4%2,664,351 |
| Figure | Randstad West | Randstad | Almere | Netherlands | Period |
|---|---|---|---|---|---|
| Households | 5 | 65 | 99,347 | 8,474,674 | 1 Jan 2026 |
| Single-person households | 5 | 55 | 33,602 | 3,412,202 | 1 Jan 2026 |
| Households without children | 0 | 5 | 24,222 | 2,398,121 | 1 Jan 2026 |
| Households with children | 0 | 0 | 41,523 | 2,664,351 | 1 Jan 2026 |
| Average household size | 1.3 | 1.1 | 2.3 | 2.1 | 1 Jan 2026 |
| Figure | 1 Jan 2024 | 1 Jan 2025 | 1 Jan 2026 |
|---|---|---|---|
| Households | 5 | 5 | 5 |
| Single-person households | 0 | 5 | 5 |
| Households without children | 0 | 5 | 0 |
| Households with children | 0 | 0 | 0 |
| Average household size | 1.4 | 1.4 | 1.3 |
Average incomes, how incomes compare with national income groups, and household wealth.
| Figure | Randstad West | Randstad | Almere | Netherlands | Period |
|---|---|---|---|---|---|
| Income recipients | 0 | 0 | 175,200 | 14,480,600 | 2024 |
Labour participation and types of employment, from register data.
Working population (register data)
10
| Figure | Randstad West | Randstad | Almere | Netherlands | Period |
|---|---|---|---|---|---|
| Working population (register data) | 10 | 20 | 125,590 | 9,601,220 | 2024 |
Education levels of residents, and pupils and students.
| Figure | Randstad West | Randstad | Almere | Netherlands | Period |
|---|---|---|---|---|---|
| Primary school pupils | 0 | 0 | 22,580 | 1,464,300 | 2025 |
| Secondary school pupils | 0 | 0 | 13,400 | 935,800 | 2025 |
| Vocational (MBO) students | 0 | 0 | 7,150 | 466,800 | 2025 |
| Higher professional (HBO) students | 0 | 0 | 5,430 | 440,220 | 2025 |
| University (WO) students | 0 | 0 | 2,260 | 335,930 | 2025 |
Business locations by sector.
Business locations
90
| Figure | Randstad West | Randstad | Almere | Netherlands | Period |
|---|---|---|---|---|---|
| Business locations | 90 | 390 | 32,760 | 2,551,540 | 1 Jan 2025 |
| Agriculture, forestry and fishing | 0 | 0 | 100 | 81,035 | 1 Jan 2025 |
| Industry and energy | 5 | 20 | 4,230 | 368,615 | 1 Jan 2025 |
| Trade, hotels and restaurants | 10 | 60 | 5,475 | 419,230 | 1 Jan 2025 |
| Transport, information and communication | 10 | 60 | 3,750 | 202,150 | 1 Jan 2025 |
| Financial services and real estate | 0 | 20 | 1,030 | 123,345 | 1 Jan 2025 |
| Business services | 30 | 130 | 8,270 | 647,530 | 1 Jan 2025 |
| Government, education and care | 30 | 80 | 6,690 | 435,095 | 1 Jan 2025 |
| Culture, recreation and other services | 5 | 20 | 3,215 | 274,540 | 1 Jan 2025 |
Registered vehicles of residents.
Motorcycles
0
| Figure | Randstad West | Randstad | Almere | Netherlands | Period |
|---|---|---|---|---|---|
| Motorcycles | 0 | – | 7,302 | 706,936 | 1 Jan 2026 |
Land, water, address density and non-residential buildings.
Total area
5 ha
Address density
2,377 per km²
Non-residential properties
49
Newly built non-residential properties
0
| Randstad West | Randstad | Almere | Netherlands | |
|---|---|---|---|---|
| Land | 100%5 ha | 100%26 ha | 52%12,924 ha | 80.9%3,362,600 ha |
| Water | 0%0 ha | 0%0 ha | 48%11,953 ha | 19.1%791,737 ha |
| Figure | Randstad West | Randstad | Almere | Netherlands | Period |
|---|---|---|---|---|---|
| Non-residential properties | 49 | 162 | 7,345 | 1,212,492 | 1 Jan 2025 |
| Newly built non-residential properties | 0 | 0 | 116 | 13,383 | 2025 |
| Total area | 5 ha | 26 ha | 24,877 ha | 4,154,337 ha | 2026 |
| Land | 5 ha | 26 ha | 12,924 ha | 3,362,600 ha | 2026 |
| Water | 0 ha | 0 ha | 11,953 ha | 791,737 ha | 2026 |
| Address density | 2,377 per km² | 2,254 per km² | 1,645 per km² | 2,093 per km² | 1 Jan 2026 |
| Figure | 2024 | 2025 | 2026 |
|---|---|---|---|
| Total area | 5 ha | 5 ha | 5 ha |
| Land | 5 ha | 5 ha | 5 ha |
| Water | 0 ha | 0 ha | 0 ha |
| Period | Randstad West |
|---|---|
| 1 Jan 2024 | 2,356 per km² |
| 1 Jan 2025 | 2,364 per km² |
| 1 Jan 2026 | 2,377 per km² |