
 Huisly
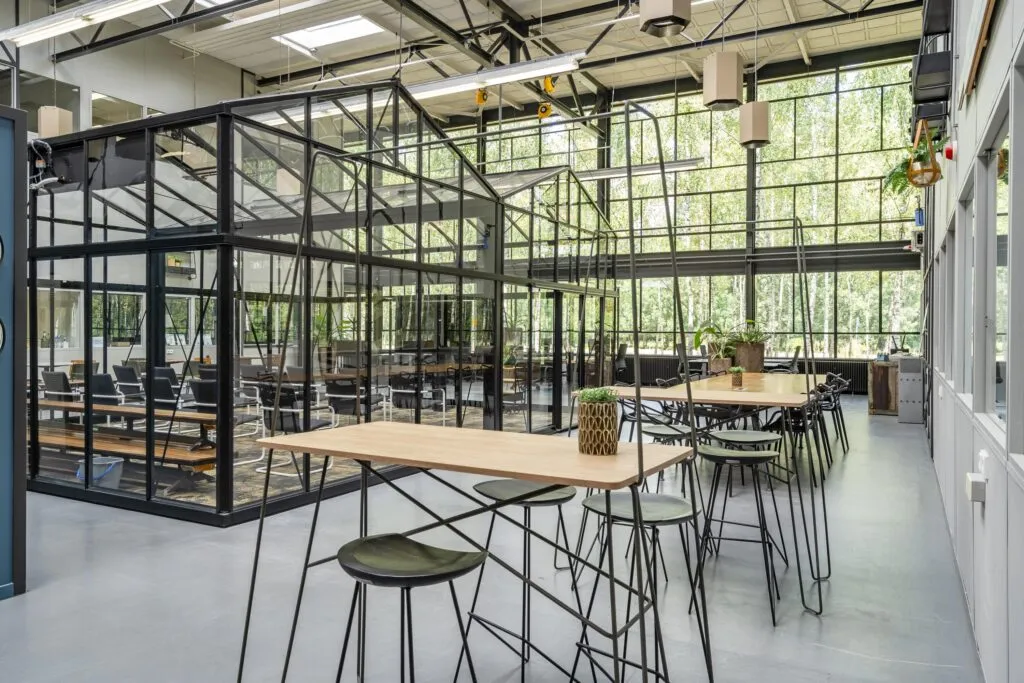
Price not available
High Tech Campus 27
Eindhoven
6503 m²A
Neighbourhood
Facts and figures about the Beemden neighbourhood in Oud-Gestel, Eindhoven from Statistics Netherlands (CBS). Each figure shows the date or year it describes and, where available, the same figure for Oud-Gestel, Eindhoven and the Netherlands over that period.
Residents
0
Households
0
Homes
0
The homes most recently listed in the Beemden neighbourhood in Oud-Gestel, Eindhoven, newest first.
Homes and their value, who owns them and what types of homes there are.
Newly built homes
0
| Figure | Beemden | Oud-Gestel | Eindhoven | Netherlands | Period |
|---|---|---|---|---|---|
| Homes | 0 | 6,958 | 121,191 | 8,274,478 | 1 Jan 2025 |
| Newly built homes | 0 | 144 | 1,529 | 69,189 | 2025 |
Residents by age, sex, marital status and origin.
Births per 1,000 residents
0
Deaths per 1,000 residents
0
| Beemden | Oud-Gestel | Eindhoven | Netherlands | |
|---|---|---|---|---|
| Men | 0%0 | 52.7%7,025 | 52.1%130,175 | 49.8%9,025,827 |
| Women | 0%0 | 47.3%6,315 | 47.9%119,608 | 50.2%9,104,381 |
| Beemden | Oud-Gestel | Eindhoven | Netherlands | |
|---|---|---|---|---|
| Never married | 0%0 | 59.2%7,900 | 57.3%143,132 | 50.2%9,101,569 |
| Married | 0%0 | 26.9%3,585 | 31.1%77,632 | 37.3%6,758,191 |
| Divorced | 0%0 | 9.4%1,250 | 7.8%19,531 | 7.7%1,404,105 |
| Widowed | 0%0 | 4.5%605 | 3.8%9,488 | 4.8%866,343 |
| Beemden | Oud-Gestel | Eindhoven | Netherlands | |
|---|---|---|---|---|
| Dutch origin | 0%0 | 46.8%6,240 | 53.1%132,619 | 70.9%12,859,141 |
| European origin (outside the Netherlands) | 0%0 | 17.8%2,380 | 15.1%37,840 | 9.6%1,739,260 |
| Origin outside Europe | 0%0 | 35.4%4,720 | 31.8%79,324 | 19.5%3,531,807 |
| Beemden | Oud-Gestel | Eindhoven | Netherlands | |
|---|---|---|---|---|
| Born in the Netherlands, Dutch origin | 0%0 | 46.8%6,240 | 53.1%132,619 | 70.9%12,859,141 |
| Born in the Netherlands, European origin | 0%0 | 4%535 | 4%10,103 | 3.4%614,116 |
| Born in the Netherlands, origin outside Europe | 0%0 | 12.1%1,615 | 10.8%26,903 | 8.5%1,532,223 |
| Born elsewhere in Europe | 0%0 | 13.8%1,845 | 11.1%27,737 | 6.2%1,125,144 |
| Born outside Europe | 0%0 | 23.3%3,105 | 21%52,421 | 11%1,999,584 |
| Figure | Beemden | Oud-Gestel | Eindhoven | Netherlands | Period |
|---|---|---|---|---|---|
| Residents | 0 | 13,340 | 249,783 | 18,130,208 | 1 Jan 2026 |
| Men | 0 | 7,025 | 130,175 | 9,025,827 | 1 Jan 2026 |
| Women | 0 | 6,315 | 119,608 | 9,104,381 | 1 Jan 2026 |
| 0–14 years | 0 | 1,525 | 33,172 | 2,683,698 | 1 Jan 2026 |
| 15–24 years | 0 | 1,680 | 36,371 | 2,203,633 | 1 Jan 2026 |
| 25–44 years | 0 | 4,670 | 81,291 | 4,699,676 | 1 Jan 2026 |
| 45–64 years | 0 | 3,060 | 57,654 | 4,709,693 | 1 Jan 2026 |
| 65–79 years | 0 | 1,710 | 29,903 | 2,876,999 | 1 Jan 2026 |
| 80 years and over | 0 | 695 | 11,392 | 956,509 | 1 Jan 2026 |
| Never married | 0 | 7,900 | 143,132 | 9,101,569 | 1 Jan 2026 |
| Married | 0 | 3,585 | 77,632 | 6,758,191 | 1 Jan 2026 |
| Divorced | 0 | 1,250 | 19,531 | 1,404,105 | 1 Jan 2026 |
| Widowed | 0 | 605 | 9,488 | 866,343 | 1 Jan 2026 |
| Dutch origin | 0 | 6,240 | 132,619 | 12,859,141 | 1 Jan 2026 |
| European origin (outside the Netherlands) | 0 | 2,380 | 37,840 | 1,739,260 | 1 Jan 2026 |
| Origin outside Europe | 0 | 4,720 | 79,324 | 3,531,807 | 1 Jan 2026 |
| Born in the Netherlands, Dutch origin | 0 | 6,240 | 132,619 | 12,859,141 | 1 Jan 2026 |
| Born in the Netherlands, European origin | 0 | 535 | 10,103 | 614,116 | 1 Jan 2026 |
| Born in the Netherlands, origin outside Europe | 0 | 1,615 | 26,903 | 1,532,223 | 1 Jan 2026 |
| Born elsewhere in Europe | 0 | 1,845 | 27,737 | 1,125,144 | 1 Jan 2026 |
| Born outside Europe | 0 | 3,105 | 52,421 | 1,999,584 | 1 Jan 2026 |
| Births | 0 | 130 | 2,228 | 166,588 | 2025 |
| Births per 1,000 residents | 0 | 10 | 9 | 9 | 2025 |
| Deaths | 0 | 130 | 2,072 | 173,494 | 2025 |
| Deaths per 1,000 residents | 0 | 10 | 8 | 10 | 2025 |
| 65 years and over | 0 | 2,350 | 40,771 | 3,755,679 | 1 Jan 2025 |
| Residents aged 15 and over | 0 | 11,830 | 216,700 | 15,450,520 | 31 Dec 2025 |
| Residents aged 15 up to state pension age | 0 | 9,690 | 180,280 | 12,071,600 | 31 Dec 2025 |
| Residents of state pension age | 0 | 2,130 | 36,420 | 3,378,920 | 31 Dec 2025 |
| Figure | 1 Jan 2024 | 1 Jan 2025 | 1 Jan 2026 |
|---|---|---|---|
| Residents | 0 | 0 | 0 |
| Men | 0 | 0 | 0 |
| Women | 0 | 0 | 0 |
| 0–14 years | 0 | 0 | 0 |
| 15–24 years | 0 | 0 | 0 |
| 25–44 years | 0 | 0 | 0 |
| 45–64 years | 0 | 0 | 0 |
| Never married | 0 | 0 | 0 |
| Married | 0 | 0 | 0 |
| Divorced | 0 | 0 | 0 |
| Widowed | 0 | 0 | 0 |
| Dutch origin | 0 | 0 | 0 |
| European origin (outside the Netherlands) | 0 | 0 | 0 |
| Origin outside Europe | 0 | 0 | 0 |
| Born in the Netherlands, Dutch origin | 0 | 0 | 0 |
| Born in the Netherlands, European origin | 0 | 0 | 0 |
| Born in the Netherlands, origin outside Europe | 0 | 0 | 0 |
| Born elsewhere in Europe | 0 | 0 | 0 |
| Born outside Europe | 0 | 0 | 0 |
| Figure | 31 Mar 2025 | 30 Jun 2025 | 30 Sept 2025 | 31 Dec 2025 |
|---|---|---|---|---|
| Residents aged 15 and over | 0 | 0 | 0 | 0 |
| Residents aged 15 up to state pension age | 0 | 0 | 0 | 0 |
| Residents of state pension age | 0 | 0 | 0 | 0 |
How many households there are and how they are made up.
| Beemden | Oud-Gestel | Eindhoven | Netherlands | |
|---|---|---|---|---|
| Single-person households | 0%0 | 56%4,225 | 50.5%66,190 | 40.3%3,412,202 |
| Households without children | 0%0 | 22.1%1,670 | 24.1%31,547 | 28.3%2,398,121 |
| Households with children | 0%0 | 21.9%1,650 | 25.4%33,268 | 31.4%2,664,351 |
| Figure | Beemden | Oud-Gestel | Eindhoven | Netherlands | Period |
|---|---|---|---|---|---|
| Households | 0 | 7,545 | 131,005 | 8,474,674 | 1 Jan 2026 |
| Single-person households | 0 | 4,225 | 66,190 | 3,412,202 | 1 Jan 2026 |
| Households without children | 0 | 1,670 | 31,547 | 2,398,121 | 1 Jan 2026 |
| Households with children | 0 | 1,650 | 33,268 | 2,664,351 | 1 Jan 2026 |
| Figure | 1 Jan 2024 | 1 Jan 2025 | 1 Jan 2026 |
|---|---|---|---|
| Households | 0 | 0 | 0 |
| Single-person households | 0 | 0 | 0 |
| Households without children | 0 | 0 | 0 |
| Households with children | 0 | 0 | 0 |
Average incomes, how incomes compare with national income groups, and household wealth.
| Figure | Beemden | Oud-Gestel | Eindhoven | Netherlands | Period |
|---|---|---|---|---|---|
| Income recipients | 0 | 11,200 | 199,400 | 14,480,600 | 2024 |
Labour participation and types of employment, from register data.
Working population (register data)
0
| Figure | Beemden | Oud-Gestel | Eindhoven | Netherlands | Period |
|---|---|---|---|---|---|
| Working population (register data) | 0 | 7,150 | 136,130 | 9,601,220 | 2024 |
Education levels of residents, and pupils and students.
| Figure | Beemden | Oud-Gestel | Eindhoven | Netherlands | Period |
|---|---|---|---|---|---|
| Primary school pupils | 0 | 820 | 18,190 | 1,464,300 | 2025 |
| Secondary school pupils | 0 | 490 | 11,560 | 935,800 | 2025 |
| Vocational (MBO) students | 0 | 310 | 5,190 | 466,800 | 2025 |
| Higher professional (HBO) students | 0 | 410 | 8,130 | 440,220 | 2025 |
| University (WO) students | 0 | 390 | 10,040 | 335,930 | 2025 |
Business locations by sector.
Business locations
280
| Figure | Beemden | Oud-Gestel | Eindhoven | Netherlands | Period |
|---|---|---|---|---|---|
| Business locations | 280 | 1,595 | 33,545 | 2,551,540 | 1 Jan 2025 |
| Agriculture, forestry and fishing | 0 | 5 | 70 | 81,035 | 1 Jan 2025 |
| Industry and energy | 35 | 265 | 3,740 | 368,615 | 1 Jan 2025 |
| Trade, hotels and restaurants | 30 | 240 | 5,830 | 419,230 | 1 Jan 2025 |
| Transport, information and communication | 75 | 220 | 3,585 | 202,150 | 1 Jan 2025 |
| Financial services and real estate | 10 | 25 | 1,600 | 123,345 | 1 Jan 2025 |
| Business services | 115 | 435 | 9,670 | 647,530 | 1 Jan 2025 |
| Government, education and care | 5 | 230 | 5,395 | 435,095 | 1 Jan 2025 |
| Culture, recreation and other services | 10 | 180 | 3,645 | 274,540 | 1 Jan 2025 |
Registered vehicles of residents.
Passenger cars
0
Motorcycles
0
| Beemden | Oud-Gestel | Eindhoven | Netherlands | |
|---|---|---|---|---|
| Petrol cars | 0%0 | 84.8%4,335 | 79.1%76,746 | 77.9%6,176,696 |
| Cars on other fuels | 0%0 | 15.2%776 | 20.9%20,253 | 22.1%1,747,986 |
| Figure | Beemden | Oud-Gestel | Eindhoven | Netherlands | Period |
|---|---|---|---|---|---|
| Passenger cars | 0 | 5,111 | 96,999 | 7,924,682 | 1 Jan 2026 |
| Petrol cars | 0 | 4,335 | 76,746 | 6,176,696 | 1 Jan 2026 |
| Cars on other fuels | 0 | 776 | 20,253 | 1,747,986 | 1 Jan 2026 |
| Motorcycles | 0 | 449 | 6,877 | 706,936 | 1 Jan 2026 |
| Figure | 1 Jan 2024 | 1 Jan 2025 | 1 Jan 2026 |
|---|---|---|---|
| Petrol cars | 0 | 0 | 0 |
| Cars on other fuels | 0 | 0 | 0 |
| Motorcycles | 0 | 0 | 0 |
Land, water, address density and non-residential buildings.
Total area
171 ha
Address density
667 per km²
Non-residential properties
50
Newly built non-residential properties
0
| Beemden | Oud-Gestel | Eindhoven | Netherlands | |
|---|---|---|---|---|
| Land | 91.8%157 ha | 96%559 ha | 98.4%8,796 ha | 80.9%3,362,600 ha |
| Water | 8.2%14 ha | 4%23 ha | 1.6%141 ha | 19.1%791,737 ha |
| Figure | Beemden | Oud-Gestel | Eindhoven | Netherlands | Period |
|---|---|---|---|---|---|
| Non-residential properties | 50 | 714 | 16,743 | 1,212,492 | 1 Jan 2025 |
| Newly built non-residential properties | 0 | 1 | 74 | 13,383 | 2025 |
| Total area | 171 ha | 582 ha | 8,936 ha | 4,154,337 ha | 2026 |
| Land | 157 ha | 559 ha | 8,796 ha | 3,362,600 ha | 2026 |
| Water | 14 ha | 23 ha | 141 ha | 791,737 ha | 2026 |
| Address density | 667 per km² | 2,598 per km² | 2,942 per km² | 2,093 per km² | 1 Jan 2026 |
| Figure | 2024 | 2025 | 2026 |
|---|---|---|---|
| Total area | 171 ha | 171 ha | 171 ha |
| Land | 158 ha | 158 ha | 157 ha |
| Water | 13 ha | 13 ha | 14 ha |
| Period | Beemden |
|---|---|
| 1 Jan 2024 | 659 per km² |
| 1 Jan 2025 | 655 per km² |
| 1 Jan 2026 | 667 per km² |