
 Huisly
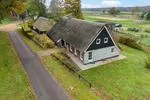
€1,195,000
Torenweg 18
Odoorn
220 m² · 7 rooms · 4 bedB
District
Facts and figures about the Odoorn district in Borger-Odoorn from Statistics Netherlands (CBS) and the EP-Online energy-label register. Each figure shows the date or year it describes and, where available, the same figure for Borger-Odoorn and the Netherlands over that period.
Residents
2,020
Households
835
Homes
958
Average WOZ value of homes
€334,000
Population density
146 per km²
The homes most recently listed in the Odoorn district in Borger-Odoorn, newest first.
Homes and their value, who owns them and what types of homes there are.
Newly built homes
0
Built in the last 10 years
5%
Unoccupied homes
5%
| Odoorn | Borger-Odoorn | Netherlands | |
|---|---|---|---|
| Owner-occupied | 64% | 74% | 57% |
| Rented from a housing association | 15% | 19% | 28% |
| Rented from another landlord | 20% | 7% | 14% |
| Odoorn | Borger-Odoorn | Netherlands | |
|---|---|---|---|
| Apartments and other multi-family homes | 19% | 9% | 37% |
| Terraced houses | 11% | 9% | 29% |
| Corner houses | 9% | 7% | 13% |
| Semi-detached houses | 23% | 22% | 9% |
| Detached houses | 38% | 53% | 13% |
| Figure | Odoorn | Borger-Odoorn | Netherlands | Period |
|---|---|---|---|---|
| Homes | 958 | 11,628 | 8,274,478 | 1 Jan 2025 |
| Newly built homes | 0 | 74 | 69,189 | 2025 |
| Average WOZ value of homes | €334,000 | €321,000 | €398,000 | 2025 |
| Single-family homes | 81% | 91% | 63% | 1 Jan 2025 |
| Terraced houses | 11% | 9% | 29% | 1 Jan 2025 |
| Corner houses | 9% | 7% | 13% | 1 Jan 2025 |
| Semi-detached houses | 23% | 22% | 9% | 1 Jan 2025 |
| Detached houses | 38% | 53% | 13% | 1 Jan 2025 |
| Apartments and other multi-family homes | 19% | 9% | 37% | 1 Jan 2025 |
| Unoccupied homes | 5% | 4% | 4% | 1 Jan 2025 |
| Owner-occupied | 64% | 74% | 57% | 1 Jan 2025 |
| Rented from a housing association | 15% | 19% | 28% | 1 Jan 2025 |
| Rented from another landlord | 20% | 7% | 14% | 1 Jan 2025 |
| Built more than 10 years ago | 95% | 95% | 92% | 1 Jan 2025 |
| Built in the last 10 years | 5% | 5% | 8% | 1 Jan 2025 |
| Rented homes | 36% | 26% | 42% | 1 Jan 2025 |
Residents by age, sex, marital status and origin.
Births per 1,000 residents
5
Deaths per 1,000 residents
30
| Odoorn | Borger-Odoorn | Netherlands | |
|---|---|---|---|
| Men | 47.9%965 | 50.4%13,173 | 49.8%9,025,827 |
| Women | 52.1%1,050 | 49.6%12,989 | 50.2%9,104,381 |
| Odoorn | Borger-Odoorn | Netherlands | |
|---|---|---|---|
| Never married | 39.6%800 | 41%10,738 | 50.2%9,101,569 |
| Married | 45.8%925 | 45.5%11,897 | 37.3%6,758,191 |
| Divorced | 5.7%115 | 7.5%1,963 | 7.7%1,404,105 |
| Widowed | 8.9%180 | 6%1,564 | 4.8%866,343 |
| Odoorn | Borger-Odoorn | Netherlands | |
|---|---|---|---|
| Dutch origin | 89.3%1,800 | 90.8%23,749 | 70.9%12,859,141 |
| European origin (outside the Netherlands) | 5.2%105 | 4.5%1,182 | 9.6%1,739,260 |
| Origin outside Europe | 5.5%110 | 4.7%1,231 | 19.5%3,531,807 |
| Odoorn | Borger-Odoorn | Netherlands | |
|---|---|---|---|
| Born in the Netherlands, Dutch origin | 89.6%1,800 | 90.8%23,749 | 70.9%12,859,141 |
| Born in the Netherlands, European origin | 1.7%35 | 1.9%499 | 3.4%614,116 |
| Born in the Netherlands, origin outside Europe | 2.2%45 | 2%526 | 8.5%1,532,223 |
| Born elsewhere in Europe | 3.5%70 | 2.6%683 | 6.2%1,125,144 |
| Born outside Europe | 3%60 | 2.7%705 | 11%1,999,584 |
| Figure | Odoorn | Borger-Odoorn | Netherlands | Period |
|---|---|---|---|---|
| Residents | 2,020 | 26,162 | 18,130,208 | 1 Jan 2026 |
| Men | 965 | 13,173 | 9,025,827 | 1 Jan 2026 |
| Women | 1,050 | 12,989 | 9,104,381 | 1 Jan 2026 |
| 0–14 years | 260 | 3,533 | 2,683,698 | 1 Jan 2026 |
| 15–24 years | 205 | 2,636 | 2,203,633 | 1 Jan 2026 |
| 25–44 years | 370 | 5,276 | 4,699,676 | 1 Jan 2026 |
| 45–64 years | 495 | 7,647 | 4,709,693 | 1 Jan 2026 |
| 65–79 years | 465 | 5,426 | 2,876,999 | 1 Jan 2026 |
| 80 years and over | 225 | 1,644 | 956,509 | 1 Jan 2026 |
| Never married | 800 | 10,738 | 9,101,569 | 1 Jan 2026 |
| Married | 925 | 11,897 | 6,758,191 | 1 Jan 2026 |
| Divorced | 115 | 1,963 | 1,404,105 | 1 Jan 2026 |
| Widowed | 180 | 1,564 | 866,343 | 1 Jan 2026 |
| Dutch origin | 1,800 | 23,749 | 12,859,141 | 1 Jan 2026 |
| European origin (outside the Netherlands) | 105 | 1,182 | 1,739,260 | 1 Jan 2026 |
| Origin outside Europe | 110 | 1,231 | 3,531,807 | 1 Jan 2026 |
| Born in the Netherlands, Dutch origin | 1,800 | 23,749 | 12,859,141 | 1 Jan 2026 |
| Born in the Netherlands, European origin | 35 | 499 | 614,116 | 1 Jan 2026 |
| Born in the Netherlands, origin outside Europe | 45 | 526 | 1,532,223 | 1 Jan 2026 |
| Born elsewhere in Europe | 70 | 683 | 1,125,144 | 1 Jan 2026 |
| Born outside Europe | 60 | 705 | 1,999,584 | 1 Jan 2026 |
| Births | 15 | 187 | 166,588 | 2025 |
| Births per 1,000 residents | 5 | 7 | 9 | 2025 |
| Deaths | 55 | 283 | 173,494 | 2025 |
| Deaths per 1,000 residents | 30 | 11 | 10 | 2025 |
| Population density | 146 per km² | 95 per km² | 539 per km² | 1 Jan 2026 |
| 65 years and over | 675 | 6,978 | 3,755,679 | 1 Jan 2025 |
| Residents aged 15 and over | 1,760 | 22,630 | 15,450,520 | 31 Dec 2025 |
| Residents aged 15 up to state pension age | 1,150 | 16,410 | 12,071,600 | 31 Dec 2025 |
| Residents of state pension age | 610 | 6,230 | 3,378,920 | 31 Dec 2025 |
| Figure | 1 Jan 2024 | 1 Jan 2025 | 1 Jan 2026 |
|---|---|---|---|
| Residents | 1,960 | 1,990 | 2,020 |
| Men | 930 | 950 | 965 |
| Women | 1,030 | 1,040 | 1,050 |
| 0–14 years | 260 | 245 | 260 |
| 15–24 years | 180 | 205 | 205 |
| 25–44 years | 340 | 360 | 370 |
| 45–64 years | 525 | 510 | 495 |
| Never married | 755 | 760 | 800 |
| Married | 895 | 915 | 925 |
| Divorced | 115 | 115 | 115 |
| Widowed | 195 | 190 | 180 |
| Dutch origin | 1,790 | 1,800 | 1,800 |
| European origin (outside the Netherlands) | 75 | 75 | 105 |
| Origin outside Europe | 95 | 105 | 110 |
| Born in the Netherlands, Dutch origin | 1,790 | 1,800 | 1,800 |
| Born in the Netherlands, European origin | 35 | 35 | 35 |
| Born in the Netherlands, origin outside Europe | 40 | 40 | 45 |
| Born elsewhere in Europe | 40 | 40 | 70 |
| Born outside Europe | 55 | 70 | 60 |
| Population density | 142 per km² | 144 per km² | 146 per km² |
| Figure | 31 Mar 2025 | 30 Jun 2025 | 30 Sept 2025 | 31 Dec 2025 |
|---|---|---|---|---|
| Residents aged 15 and over | 1,750 | 1,740 | 1,750 | 1,760 |
| Residents aged 15 up to state pension age | 1,140 | 1,140 | 1,140 | 1,150 |
| Residents of state pension age | 610 | 600 | 600 | 610 |
How many households there are and how they are made up.
Average household size
2.2
| Odoorn | Borger-Odoorn | Netherlands | |
|---|---|---|---|
| Single-person households | 29.2%245 | 30.3%3,541 | 40.3%3,412,202 |
| Households without children | 40.5%340 | 38.2%4,466 | 28.3%2,398,121 |
| Households with children | 30.4%255 | 31.5%3,677 | 31.4%2,664,351 |
| Figure | Odoorn | Borger-Odoorn | Netherlands | Period |
|---|---|---|---|---|
| Households | 835 | 11,684 | 8,474,674 | 1 Jan 2026 |
| Single-person households | 245 | 3,541 | 3,412,202 | 1 Jan 2026 |
| Households without children | 340 | 4,466 | 2,398,121 | 1 Jan 2026 |
| Households with children | 255 | 3,677 | 2,664,351 | 1 Jan 2026 |
| Average household size | 2.2 | 2.2 | 2.1 | 1 Jan 2026 |
| Figure | 1 Jan 2024 | 1 Jan 2025 | 1 Jan 2026 |
|---|---|---|---|
| Households | 805 | 825 | 835 |
| Single-person households | 230 | 245 | 245 |
| Households without children | 325 | 330 | 340 |
| Households with children | 250 | 245 | 255 |
| Average household size | 2.2 | 2.2 | 2.2 |
Average incomes, how incomes compare with national income groups, and household wealth.
Median household wealth
€222,100
People living in poverty
1.6%
People up to 25% above the poverty line
3.5%
| Odoorn | Borger-Odoorn | Netherlands | |
|---|---|---|---|
| People in the lowest 40% of incomes (national) | 40.6% | 42.2% | 40% |
| Middle 40% of incomes (national) | 41% | 42.2% | 40% |
| People in the highest 20% of incomes (national) | 18.4% | 15.6% | 20% |
| Odoorn | Borger-Odoorn | Netherlands | |
|---|---|---|---|
| Households in the lowest 40% of incomes (national) | 31.9% | 35% | 40% |
| Households in the middle 40% of incomes (national) | 48.3% | 46.8% | 40% |
| Households in the highest 20% of incomes (national) | 19.8% | 18.2% | 20% |
| Figure | Odoorn | Borger-Odoorn | Netherlands | Period |
|---|---|---|---|---|
| Income recipients | 1,500 | 21,600 | 14,480,600 | 2024 |
| People in the lowest 40% of incomes (national) | 40.6% | 42.2% | 40% | 2024 |
| People in the highest 20% of incomes (national) | 18.4% | 15.6% | 20% | 2024 |
| People living in poverty | 1.6% | 2.2% | 3.1% | 2024 |
| People up to 25% above the poverty line | 3.5% | 5.2% | 6.4% | 2024 |
| Households in the lowest 40% of incomes (national) | 31.9% | 35% | 40% | 2024 |
| Households in the highest 20% of incomes (national) | 19.8% | 18.2% | 20% | 2024 |
| Median household wealth | €222,100 | €169,500 | €135,500 | 2024 |
Labour participation and types of employment, from register data.
Working population (register data)
880
Net labour participation (register data)
70%
| Odoorn | Borger-Odoorn | Netherlands | |
|---|---|---|---|
| Employees with a permanent contract (register data) | 58% | 57% | 56% |
| Employees with a flexible contract (register data) | 25% | 24% | 27% |
| Self-employed (register data) | 17% | 19% | 17% |
| Figure | Odoorn | Borger-Odoorn | Netherlands | Period |
|---|---|---|---|---|
| Working population (register data) | 880 | 13,230 | 9,601,220 | 2024 |
| Net labour participation (register data) | 70% | 69% | 72% | 2024 |
| Employees (register data) | 83% | 81% | 83% | 2024 |
| Employees with a permanent contract (register data) | 58% | 57% | 56% | 2024 |
| Employees with a flexible contract (register data) | 25% | 24% | 27% | 2024 |
| Self-employed (register data) | 17% | 19% | 17% | 2024 |
Residents receiving a benefit or state pension.
| Figure | Odoorn | Borger-Odoorn | Netherlands | Period |
|---|---|---|---|---|
| People on social assistance | 30 | 440 | 409,890 | 31 Dec 2025 |
| People on disability benefit | 130 | 1,460 | 798,610 | 31 Dec 2025 |
| People on unemployment benefit (WW) | 10 | 220 | 173,170 | 31 Dec 2025 |
| People receiving state pension (AOW) | 610 | 6,220 | 3,359,140 | 31 Dec 2025 |
| Unemployment benefit (WW), share of residents aged 15 and over | 1% | 1% | 1% | 31 Dec 2025 |
| Social assistance, share of residents aged 15 and over | 2% | 2% | 3% | 31 Dec 2025 |
| Disability benefit, share of residents aged 15 and over | 7% | 6% | 5% | 31 Dec 2025 |
| State pension (AOW), share of residents aged 15 and over | 35% | 27% | 22% | 31 Dec 2025 |
| Figure | 31 Dec 2024 | 31 Mar 2025 | 30 Jun 2025 | 30 Sept 2025 | 31 Dec 2025 |
|---|---|---|---|---|---|
| People on social assistance | 30 | 30 | 30 | 30 | 30 |
| People on disability benefit | 130 | 130 | 130 | 130 | 130 |
| People on unemployment benefit (WW) | 20 | 20 | 10 | 10 | 10 |
| People receiving state pension (AOW) | 600 | 610 | 600 | 600 | 610 |
| Figure | 31 Mar 2025 | 30 Jun 2025 | 30 Sept 2025 | 31 Dec 2025 |
|---|---|---|---|---|
| Unemployment benefit (WW), share of residents aged 15 and over | 1% | 1% | 0% | 1% |
| Social assistance, share of residents aged 15 and over | 2% | 2% | 2% | 2% |
| Disability benefit, share of residents aged 15 and over | 7% | 7% | 7% | 7% |
| State pension (AOW), share of residents aged 15 and over | 35% | 34% | 34% | 35% |
Education levels of residents, and pupils and students.
| Odoorn | Borger-Odoorn | Netherlands | |
|---|---|---|---|
| Lower education (primary, VMBO, MBO 1) | 20.7%280 | 26.4%5,100 | 26%3,527,040 |
| Middle education (HAVO, VWO, MBO 2–4) | 49.6%670 | 47.5%9,190 | 40.7%5,525,940 |
| Higher education (HBO, university) | 29.6%400 | 26.1%5,040 | 33.3%4,518,570 |
| Figure | Odoorn | Borger-Odoorn | Netherlands | Period |
|---|---|---|---|---|
| Primary school pupils | 140 | 1,970 | 1,464,300 | 2025 |
| Secondary school pupils | 100 | 1,210 | 935,800 | 2025 |
| Vocational (MBO) students | 60 | 750 | 466,800 | 2025 |
| Higher professional (HBO) students | 30 | 390 | 440,220 | 2025 |
| University (WO) students | 10 | 100 | 335,930 | 2025 |
| Lower education (primary, VMBO, MBO 1) | 280 | 5,100 | 3,527,040 | 1 Oct 2023 |
| Middle education (HAVO, VWO, MBO 2–4) | 670 | 9,190 | 5,525,940 | 1 Oct 2023 |
| Higher education (HBO, university) | 400 | 5,040 | 4,518,570 | 1 Oct 2023 |
| Lower education: lower bound (95%) | 220 | 4,780 | 3,517,510 | 1 Oct 2023 |
| Lower education: upper bound (95%) | 340 | 5,470 | 3,538,970 | 1 Oct 2023 |
| Middle education: lower bound (95%) | 600 | 8,780 | 5,516,770 | 1 Oct 2023 |
| Middle education: upper bound (95%) | 750 | 9,620 | 5,537,190 | 1 Oct 2023 |
| Higher education: lower bound (95%) | 350 | 4,580 | 4,506,580 | 1 Oct 2023 |
| Higher education: upper bound (95%) | 460 | 5,600 | 4,526,040 | 1 Oct 2023 |
Average energy use of homes and how homes are heated and powered.
Average electricity use per home
2,820 kWh
Average natural gas use per home
1,080 m³
Average electricity returned to the grid per home
1,540 kWh
| Figure | Odoorn | Borger-Odoorn | Netherlands | Period |
|---|---|---|---|---|
| Average electricity use per home | 2,820 kWh | 3,170 kWh | 2,580 kWh | 2025 |
| Average electricity returned to the grid per home | 1,540 kWh | 1,780 kWh | 930 kWh | 2025 |
| Average natural gas use per home | 1,080 m³ | 1,100 m³ | 800 m³ | 2024 |
| Homes without natural gas | 5% | 6% | 12% | 2025 |
| Homes using natural gas | 79% | 83% | 81% | 2025 |
| Homes with solar power | 53% | 60% | 37% | 2025 |
| Homes mainly heated electrically | 12% | 15% | 10% | 2025 |
Registered energy labels of homes, from the EP-Online register. The label shares count only homes with a registered label.
Homes with a registered energy label (share)
55.2%
Label A or better
37%
Label E, F or G
8.4%
Homes with a registered energy label
479
| Figure | Odoorn | Borger-Odoorn | Netherlands | Period |
|---|---|---|---|---|
| Homes with a registered energy label | 479 | 6,466 | 5,299,893 | 8 Nov 2026 |
| Homes with a registered energy label (share) | 55.2% | 58.1% | 62.2% | 8 Nov 2026 |
| Label A+++++ | 0% | 0% | 0% | 8 Nov 2026 |
| Label A++++ | 3.1% | 1.7% | 1.2% | 8 Nov 2026 |
| Label A+++ | 1% | 3.2% | 4.1% | 8 Nov 2026 |
| Label A++ | 1% | 1.2% | 2.6% | 8 Nov 2026 |
| Label A+ | 3.3% | 2.6% | 4.7% | 8 Nov 2026 |
| Label A | 28.4% | 25.8% | 31.9% | 8 Nov 2026 |
| Label B | 19.6% | 16.2% | 16.5% | 8 Nov 2026 |
| Label C | 29.6% | 25.4% | 21.6% | 8 Nov 2026 |
| Label D | 5.4% | 9.1% | 7.8% | 8 Nov 2026 |
| Label E | 2.3% | 5.1% | 4.4% | 8 Nov 2026 |
| Label F | 3.3% | 4.3% | 2.6% | 8 Nov 2026 |
| Label G | 2.7% | 5.4% | 2.5% | 8 Nov 2026 |
| Label A or better | 37% | 34.5% | 44.5% | 8 Nov 2026 |
| Label E, F or G | 8.4% | 14.8% | 9.6% | 8 Nov 2026 |
Youth care and support under the Social Support Act (Wmo).
Young people receiving youth care (share)
9.8%
Young people receiving youth care
40
Social support (Wmo) clients per 1,000 residents
130
Social support (Wmo) clients
255
| Figure | Odoorn | Borger-Odoorn | Netherlands | Period |
|---|---|---|---|---|
| Young people receiving youth care | 40 | 675 | 486,965 | 2024 |
| Young people receiving youth care (share) | 9.8% | 11.9% | 11% | 2024 |
| Social support (Wmo) clients | 255 | 2,185 | 1,283,855 | 2024 |
| Social support (Wmo) clients per 1,000 residents | 130 | 84 | 72 | 2024 |
How far residents live from everyday amenities such as shops, GPs, schools and train stations.
Average road distance from residents' homes to the nearest facility, and the average number of facilities within a given road distance.
1 Jan 2025 · Borger-Odoorn: 2.2 km · Netherlands: 1 km · 0.6 within 1 km · 1 within 3 km · 1.9 within 5 km
1 Jan 2025 · Borger-Odoorn: 1.5 km · Netherlands: 0.9 km · 1.8 within 1 km · 4.5 within 3 km · 8.3 within 5 km
1 Jan 2025 · Borger-Odoorn: 5.9 km · Netherlands: 2.7 km · 0 within 5 km · 1.8 within 10 km · 6.9 within 20 km
1 Jan 2025 · Borger-Odoorn: 1.9 km · Netherlands: 1.1 km · 0.8 within 1 km · 1 within 3 km · 2 within 5 km
1 Jan 2025 · Borger-Odoorn: 11.6 km · Netherlands: 7.1 km
1 Jan 2025 · Borger-Odoorn: 3.3 km · Netherlands: 1.3 km
1 Jan 2025 · Borger-Odoorn: 11.6 km · Netherlands: 5 km · 0 within 5 km · 0.6 within 10 km · 1 within 20 km
1 Jan 2025 · Borger-Odoorn: 11.6 km · Netherlands: 7.2 km · 0 within 5 km · 0.6 within 10 km · 1 within 20 km
1 Jan 2025 · Borger-Odoorn: 1.4 km · Netherlands: 0.7 km · 1.4 within 1 km · 3.2 within 3 km · 4.9 within 5 km
1 Jan 2025 · Borger-Odoorn: 1.5 km · Netherlands: 0.7 km · 0.8 within 1 km · 2 within 3 km · 3 within 5 km
1 Jan 2025 · Borger-Odoorn: 1.4 km · Netherlands: 0.8 km · 0.6 within 1 km · 1 within 3 km · 2.9 within 5 km
1 Jan 2025 · Borger-Odoorn: 5.6 km · Netherlands: 2.5 km · 0 within 3 km · 0 within 5 km · 3.3 within 10 km
1 Jan 2025 · Borger-Odoorn: 5.6 km · Netherlands: 2.6 km · 0 within 3 km · 0 within 5 km · 3.3 within 10 km
1 Jan 2025 · Borger-Odoorn: 10 km · Netherlands: 3.4 km · 0 within 3 km · 0 within 5 km · 1.1 within 10 km
1 Jan 2025 · Borger-Odoorn: 15.7 km · Netherlands: 5.2 km
1 Jan 2025 · Borger-Odoorn: 16.8 km · Netherlands: 10.8 km
1 Jan 2025 · Borger-Odoorn: 2 km · Netherlands: 1.8 km
1 Jan 2025 · Borger-Odoorn: 1.1 km · Netherlands: 0.9 km · 0.8 within 1 km · 2.9 within 3 km · 7.3 within 5 km
1 Jan 2025 · Borger-Odoorn: 5.1 km · Netherlands: 1.5 km · 0 within 1 km · 0 within 3 km · 0.3 within 5 km
1 Jan 2025 · Borger-Odoorn: 1.7 km · Netherlands: 0.8 km · 2 within 1 km · 3 within 3 km · 5.6 within 5 km
1 Jan 2025 · Borger-Odoorn: 3 km · Netherlands: 2.7 km · 4.6 within 5 km · 12.2 within 10 km · 23.8 within 20 km
1 Jan 2025 · Borger-Odoorn: 2.4 km · Netherlands: 2 km
1 Jan 2025 · Borger-Odoorn: 12.7 km · Netherlands: 3.5 km
1 Jan 2025 · Borger-Odoorn: 47.2 km · Netherlands: 19.4 km
1 Jan 2025 · Borger-Odoorn: 5.9 km · Netherlands: 4 km · 0 within 5 km · 1.9 within 10 km · 6.3 within 20 km
1 Jan 2025 · Borger-Odoorn: 10.9 km · Netherlands: 4.7 km · 0 within 5 km · 1 within 10 km · 2 within 20 km
1 Jan 2025 · Borger-Odoorn: 40.5 km · Netherlands: 10.1 km
1 Jan 2025 · Borger-Odoorn: 10.8 km · Netherlands: 6.6 km · 0 within 5 km · 1 within 10 km · 2 within 20 km
1 Jan 2025 · Borger-Odoorn: 18.3 km · Netherlands: 7.7 km
1 Jan 2025 · Borger-Odoorn: 9.9 km · Netherlands: 4.4 km
1 Jan 2025 · Borger-Odoorn: 6.8 km · Netherlands: 5.6 km · 2 within 10 km · 6 within 20 km · 18.6 within 50 km
1 Jan 2025 · Borger-Odoorn: 4.3 km · Netherlands: 2.2 km
| Figure | Odoorn | Borger-Odoorn | Netherlands | Period |
|---|---|---|---|---|
| GP practice: average distance | 0.8 km | 1.9 km | 1.1 km | 1 Jan 2025 |
| Large supermarket: average distance | 0.9 km | 2.2 km | 1 km | 1 Jan 2025 |
| Daycare: average distance | 0.8 km | 1.4 km | 0.7 km | 1 Jan 2025 |
| Primary school: average distance | 0.9 km | 1.4 km | 0.8 km | 1 Jan 2025 |
| Primary school: average number within 3 km | 1 | 2.2 | 9.8 | 1 Jan 2025 |
| GP practice: average number within 1 km | 0.8 | 0.5 | 1.2 | 1 Jan 2025 |
| GP practice: average number within 3 km | 1 | 1.3 | 7.7 | 1 Jan 2025 |
| GP practice: average number within 5 km | 2 | 2.3 | 16.9 | 1 Jan 2025 |
| GP out-of-hours service: average distance | 10 km | 11.6 km | 7.1 km | 1 Jan 2025 |
| Pharmacy: average distance | 0.8 km | 3.3 km | 1.3 km | 1 Jan 2025 |
| Hospital or outpatient clinic: average distance | 10 km | 11.6 km | 5 km | 1 Jan 2025 |
| Hospital or outpatient clinic: average number within 5 km | 0 | 0.1 | 1.1 | 1 Jan 2025 |
| Hospital or outpatient clinic: average number within 10 km | 0.6 | 0.3 | 2.8 | 1 Jan 2025 |
| Hospital or outpatient clinic: average number within 20 km | 1 | 1.6 | 8.3 | 1 Jan 2025 |
| Hospital (excluding outpatient clinics): average distance | 10 km | 11.6 km | 7.2 km | 1 Jan 2025 |
| Hospital (excluding outpatient clinics): average number within 5 km | 0 | 0.1 | 0.7 | 1 Jan 2025 |
| Hospital (excluding outpatient clinics): average number within 10 km | 0.6 | 0.3 | 1.6 | 1 Jan 2025 |
| Hospital (excluding outpatient clinics): average number within 20 km | 1 | 1.6 | 4.3 | 1 Jan 2025 |
| Large supermarket: average number within 1 km | 0.6 | 0.5 | 1.7 | 1 Jan 2025 |
| Large supermarket: average number within 3 km | 1 | 1.5 | 11 | 1 Jan 2025 |
| Large supermarket: average number within 5 km | 1.9 | 3.2 | 23.7 | 1 Jan 2025 |
| Other daily groceries: average distance | 0.8 km | 1.5 km | 0.9 km | 1 Jan 2025 |
| Other daily groceries: average number within 1 km | 1.8 | 1.4 | 6.9 | 1 Jan 2025 |
| Other daily groceries: average number within 3 km | 4.5 | 3.9 | 47.1 | 1 Jan 2025 |
| Other daily groceries: average number within 5 km | 8.3 | 8.8 | 102.3 | 1 Jan 2025 |
| Department store: average distance | 8.9 km | 5.9 km | 2.7 km | 1 Jan 2025 |
| Department store: average number within 5 km | 0 | 0.4 | 2.4 | 1 Jan 2025 |
| Department store: average number within 10 km | 1.8 | 1.2 | 6.8 | 1 Jan 2025 |
| Department store: average number within 20 km | 6.9 | 5.5 | 19.9 | 1 Jan 2025 |
| Café: average distance | 5.3 km | 5.1 km | 1.5 km | 1 Jan 2025 |
| Café: average number within 1 km | 0 | 0 | 2.7 | 1 Jan 2025 |
| Café: average number within 3 km | 0 | 0.3 | 22.3 | 1 Jan 2025 |
| Café: average number within 5 km | 0.3 | 1.3 | 48.1 | 1 Jan 2025 |
| Snack bar: average distance | 0.7 km | 1.7 km | 0.8 km | 1 Jan 2025 |
| Snack bar: average number within 1 km | 2 | 1.1 | 5.8 | 1 Jan 2025 |
| Snack bar: average number within 3 km | 3 | 3.4 | 46.1 | 1 Jan 2025 |
| Snack bar: average number within 5 km | 5.6 | 7.3 | 99.9 | 1 Jan 2025 |
| Restaurant: average distance | 0.7 km | 1.1 km | 0.9 km | 1 Jan 2025 |
| Restaurant: average number within 1 km | 0.8 | 1.3 | 8 | 1 Jan 2025 |
| Restaurant: average number within 3 km | 2.9 | 3.6 | 65.6 | 1 Jan 2025 |
| Restaurant: average number within 5 km | 7.3 | 8.3 | 143.6 | 1 Jan 2025 |
| Hotel: average distance | 0.7 km | 3 km | 2.7 km | 1 Jan 2025 |
| Hotel: average number within 5 km | 4.6 | 2.9 | 17.6 | 1 Jan 2025 |
| Hotel: average number within 10 km | 12.2 | 8.5 | 42.8 | 1 Jan 2025 |
| Hotel: average number within 20 km | 23.8 | 23.9 | 99.4 | 1 Jan 2025 |
| Daycare: average number within 1 km | 1.4 | 0.8 | 2.8 | 1 Jan 2025 |
| Daycare: average number within 3 km | 3.2 | 2.4 | 19.2 | 1 Jan 2025 |
| Daycare: average number within 5 km | 4.9 | 5.2 | 43.9 | 1 Jan 2025 |
| After-school care: average distance | 0.8 km | 1.5 km | 0.7 km | 1 Jan 2025 |
| After-school care: average number within 1 km | 0.8 | 0.7 | 2.2 | 1 Jan 2025 |
| After-school care: average number within 3 km | 2 | 2.3 | 14.7 | 1 Jan 2025 |
| After-school care: average number within 5 km | 3 | 4.9 | 33.7 | 1 Jan 2025 |
| Primary school: average number within 1 km | 0.6 | 0.8 | 1.6 | 1 Jan 2025 |
| Primary school: average number within 5 km | 2.9 | 4.8 | 22 | 1 Jan 2025 |
| Secondary school: average distance | 8.5 km | 5.6 km | 2.5 km | 1 Jan 2025 |
| Secondary school: average number within 3 km | 0 | 0.4 | 3.7 | 1 Jan 2025 |
| Secondary school: average number within 5 km | 0 | 1.1 | 8 | 1 Jan 2025 |
| Secondary school: average number within 10 km | 3.3 | 2.6 | 20.5 | 1 Jan 2025 |
| VMBO school: average distance | 8.5 km | 5.6 km | 2.6 km | 1 Jan 2025 |
| VMBO school: average number within 3 km | 0 | 0.4 | 3.3 | 1 Jan 2025 |
| VMBO school: average number within 5 km | 0 | 1.1 | 7 | 1 Jan 2025 |
| VMBO school: average number within 10 km | 3.3 | 2.6 | 18.3 | 1 Jan 2025 |
| HAVO/VWO school: average distance | 9.8 km | 10 km | 3.4 km | 1 Jan 2025 |
| HAVO/VWO school: average number within 3 km | 0 | 0.1 | 2 | 1 Jan 2025 |
| HAVO/VWO school: average number within 5 km | 0 | 0.2 | 4.4 | 1 Jan 2025 |
| HAVO/VWO school: average number within 10 km | 1.1 | 0.6 | 11.3 | 1 Jan 2025 |
| Motorway access: average distance | 3.4 km | 2 km | 1.8 km | 1 Jan 2025 |
| Train station: average distance | 9 km | 15.7 km | 5.2 km | 1 Jan 2025 |
| Major interchange station: average distance | 9 km | 16.8 km | 10.8 km | 1 Jan 2025 |
| Library: average distance | 0.7 km | 2.4 km | 2 km | 1 Jan 2025 |
| Indoor swimming pool: average distance | 12.9 km | 12.7 km | 3.5 km | 1 Jan 2025 |
| Ice rink: average distance | 51.1 km | 47.2 km | 19.4 km | 1 Jan 2025 |
| Museum: average distance | 9.2 km | 5.9 km | 4 km | 1 Jan 2025 |
| Museum: average number within 5 km | 0 | 0.5 | 3.4 | 1 Jan 2025 |
| Museum: average number within 10 km | 1.9 | 1.1 | 8.4 | 1 Jan 2025 |
| Museum: average number within 20 km | 6.3 | 5.3 | 22.4 | 1 Jan 2025 |
| Performing arts venue: average distance | 9.5 km | 10.9 km | 4.7 km | 1 Jan 2025 |
| Performing arts venue: average number within 5 km | 0 | 0.2 | 3.5 | 1 Jan 2025 |
| Performing arts venue: average number within 10 km | 1 | 0.4 | 8.2 | 1 Jan 2025 |
| Performing arts venue: average number within 20 km | 2 | 2.3 | 19.3 | 1 Jan 2025 |
| Pop music venue: average distance | 37 km | 40.5 km | 10.1 km | 1 Jan 2025 |
| Cinema: average distance | 9.1 km | 10.8 km | 6.6 km | 1 Jan 2025 |
| Cinema: average number within 5 km | 0 | 0.2 | 1.2 | 1 Jan 2025 |
| Cinema: average number within 10 km | 1 | 0.4 | 2.8 | 1 Jan 2025 |
| Cinema: average number within 20 km | 2 | 1.8 | 7.1 | 1 Jan 2025 |
| Sauna: average distance | 10.2 km | 18.3 km | 7.7 km | 1 Jan 2025 |
| Tanning salon: average distance | 8.2 km | 9.9 km | 4.4 km | 1 Jan 2025 |
| Attraction: average distance | 4.3 km | 6.8 km | 5.6 km | 1 Jan 2025 |
| Attraction: average number within 10 km | 2 | 1.3 | 2.9 | 1 Jan 2025 |
| Attraction: average number within 20 km | 6 | 4.5 | 8.6 | 1 Jan 2025 |
| Attraction: average number within 50 km | 18.6 | 18.4 | 39.8 | 1 Jan 2025 |
| Fire station: average distance | 8.7 km | 4.3 km | 2.2 km | 1 Jan 2025 |
Business locations by sector.
Business locations
195
| Figure | Odoorn | Borger-Odoorn | Netherlands | Period |
|---|---|---|---|---|
| Business locations | 195 | 3,280 | 2,551,540 | 1 Jan 2025 |
| Agriculture, forestry and fishing | 5 | 320 | 81,035 | 1 Jan 2025 |
| Industry and energy | 25 | 540 | 368,615 | 1 Jan 2025 |
| Trade, hotels and restaurants | 35 | 580 | 419,230 | 1 Jan 2025 |
| Transport, information and communication | 5 | 160 | 202,150 | 1 Jan 2025 |
| Financial services and real estate | 15 | 135 | 123,345 | 1 Jan 2025 |
| Business services | 45 | 630 | 647,530 | 1 Jan 2025 |
| Government, education and care | 40 | 545 | 435,095 | 1 Jan 2025 |
| Culture, recreation and other services | 25 | 370 | 274,540 | 1 Jan 2025 |
Registered vehicles of residents.
Passenger cars
1,080
Cars per household
1.3
Car density
78 per km²
Motorcycles
126
| Odoorn | Borger-Odoorn | Netherlands | |
|---|---|---|---|
| Petrol cars | 73.9%798 | 75.5%11,208 | 77.9%6,176,696 |
| Cars on other fuels | 26.1%282 | 24.5%3,632 | 22.1%1,747,986 |
| Figure | Odoorn | Borger-Odoorn | Netherlands | Period |
|---|---|---|---|---|
| Passenger cars | 1,080 | 14,840 | 7,924,682 | 1 Jan 2026 |
| Petrol cars | 798 | 11,208 | 6,176,696 | 1 Jan 2026 |
| Cars on other fuels | 282 | 3,632 | 1,747,986 | 1 Jan 2026 |
| Cars per household | 1.3 | 1.3 | 0.9 | 1 Jan 2026 |
| Car density | 78 per km² | 54 per km² | 236 per km² | 1 Jan 2026 |
| Motorcycles | 126 | 1,946 | 706,936 | 1 Jan 2026 |
| Figure | 1 Jan 2024 | 1 Jan 2025 | 1 Jan 2026 |
|---|---|---|---|
| Petrol cars | 794 | 784 | 798 |
| Cars on other fuels | 248 | 266 | 282 |
| Cars per household | 1.3 | 1.3 | 1.3 |
| Motorcycles | 103 | 114 | 126 |
Land, water, address density and non-residential buildings.
Total area
1,381 ha
Address density
257 per km²
Non-residential properties
30
Newly built non-residential properties
1
| Odoorn | Borger-Odoorn | Netherlands | |
|---|---|---|---|
| Land | 100%1,381 ha | 98.9%27,486 ha | 80.9%3,362,600 ha |
| Water | 0%0 ha | 1.1%304 ha | 19.1%791,737 ha |
| Figure | Odoorn | Borger-Odoorn | Netherlands | Period |
|---|---|---|---|---|
| Non-residential properties | 30 | 1,877 | 1,212,492 | 1 Jan 2025 |
| Newly built non-residential properties | 1 | 26 | 13,383 | 2025 |
| Total area | 1,381 ha | 27,789 ha | 4,154,337 ha | 2026 |
| Land | 1,381 ha | 27,486 ha | 3,362,600 ha | 2026 |
| Water | 0 ha | 304 ha | 791,737 ha | 2026 |
| Address density | 257 per km² | 267 per km² | 2,093 per km² | 1 Jan 2026 |
| Figure | 2024 | 2025 | 2026 |
|---|---|---|---|
| Total area | 1,381 ha | 1,381 ha | 1,381 ha |
| Land | 1,381 ha | 1,381 ha | 1,381 ha |
| Water | 0 ha | 0 ha | 0 ha |
| Period | Odoorn |
|---|---|
| 1 Jan 2024 | 254 per km² |
| 1 Jan 2025 | 257 per km² |
| 1 Jan 2026 | 257 per km² |
Odoorn is divided into 4 neighbourhoods.